The Himalayas stand as Earth’s highest mountain range, possibly the highest ever. How did it form? Why is it so tall?
You might think understanding big mountain ranges requires big measurements – perhaps satellite imaging over tens or hundreds of thousands of square miles. Although scientists certainly use satellite data, many of us, including me, study the biggest of mountain ranges by relying on the smallest of measurements in tiny minerals that grew as the mountain range formed.
These minerals are found in metamorphic rocks– rocks transformed by heat, pressure or both. One of the great joys in studying metamorphic rocks lies in microanalysis of their minerals. With measurements on scales smaller than the thickness of a human hair, we can unlock the age and chemical compositions hidden inside tiny crystals to understand processes occurring on a colossal scale.
Measuring Radioactive Elements
Minerals containing radioactive elements are of special interest because these elements, called parents, decay at known rates to form stable elements, called daughters. By measuring the ratio of parent to daughter, we can determine how old a mineral is.
With microanalysis, we can even measure different ages in different parts of a crystal to determine different growth stages. By linking the chemistry of different zones within a mineral to events in the history of a mountain range, researchers can infer how the mountain range was assembled and how quickly.
A snapshot of Annapurna, one mountain in the Himalayan range, taken by the author in 2014. Matthew J. Kohn, CC BY-NC-ND
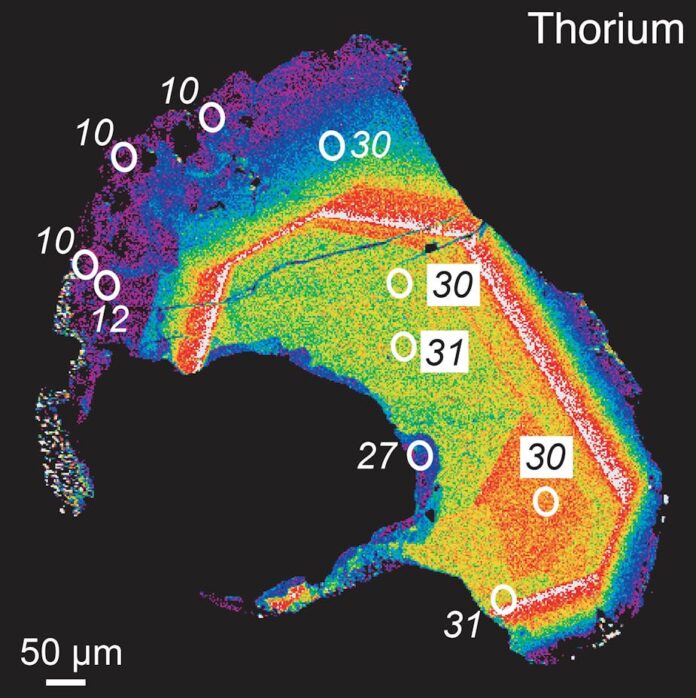
My research team and I analyzed and imaged a single grain of metamorphic monazite from rocks we collected from the Annapurna region of central Nepal. Though only 0.07 inches (1.75 mm) long, this is a gigantic crystal by geologists standards – roughly 30 times larger than typical monazite crystals. We nicknamed it “Monzilla.”
Using an electron probe microanalyzer, we collected and visualized data on the concentration of thorium – a radioactive element similar to uranium – in the crystal. Colors show the distribution of thorium, where white and red indicate higher concentrations, while blue and purple indicate lower concentrations. Numbers superimposed on the image represent age in millions of years.
Thorium-lead dating measures the ratio of parent thorium to its daughter lead; this ratio depends on thorium’s decay rate and the age of the crystal. We see two different zones are present in the sample: a roughly 30 million-year-old core with high thorium concentrations and a roughly 10 million-year-old, blobby rim with low thorium concentrations.
What Do These Ages Signify?
As the Indian tectonic plate crunches northward into Asia, rocks are first buried deeply, then thrust southward on huge faults. These faults are presently responsible for some of the most catastrophic earthquakes on our planet. As one example, in 2015, the magnitude 7.8 Gorkha earthquake in central Nepal triggered landslides that obliterated the town of Langtang, where I had worked about a dozen years prior. An estimated 329 people died there, and only 14 survived.
Our chemical analyses of this monazite crystal and nearby samples indicate that these rocks were buried deep underneath thrust faults, causing them to partially melt and form the roughly 30 million-year-old monazite core. About 10 million years ago, the rocks were carried up on a major thrust fault, forming the monazite rim. This data shows that building mountain ranges takes a long time – at least 30 million years, in this case – and that rocks basically cycle through them.
By studying rocks in other locations, we can chart the movement of these thrusts and better understand the origins of the Himalayas.
Matthew J. Kohn is a Professor of Geosciences at Boise State University. This article is republished from The Conversation under a Creative Commons license. Read the original article.
Source : Discovermagazine


